Running a print on demand store without analytics is like driving blindfolded. You might get somewhere, but you'll probably waste time and money.
Data, performance metrics, and insights help make smarter decisions, optimize your store, and boost sales.
Google Analytics (GA) answers all the questions, such as how they find you and when they leave.
This is why the more data you have, the better you can fine-tune your strategy.
Quick answer: How to use analytics for a print on demand store
Use analytics for a print on demand store by setting up Google Analytics, tracking traffic sources, monitoring conversion rates, and identifying best-selling products. Use the data to improve product pages, reduce cart abandonment, optimize SEO, adjust ad spend, and increase repeat purchases.
Let's go more in-depth now!

Start your store on Shopify
Free 3-day trial + $1/month for 3 months
- Grows with you from first test product to full brand
- Thousands of apps and hundreds of themes to customize your store
- Beginner-friendly editor with pro features when you're ready
No card to start. Cancel anytime.
Why analytics matter for print on demand stores
When you dig into your store's analytics, you get valuable insights that help you improve your strategy.
Instead of guessing what might work, you can see which products and services capture your audience's attention and how your store performs over time.
For example, if coffee mugs with motivational quotes sell twice as much as travel mugs with abstract designs, you can run more ads for the best-selling products or create similar designs.

Similarly, if your data reveals that Facebook Ads drive more sales than Instagram, you can confidently shift your ad budget to where it counts.
Analytics also shows you how visitors move through your website.
When you see which pages keep them engaged and where they might drop off, you can adjust your layout or call-to-action placements to create a smoother shopping experience.
And by reviewing trends, such as steady Q4 sales, you can predict future demand and set realistic goals for the next season.
So, when you tap into your analytics, you turn everyday data into practical, actionable steps that help you refine your product offerings, boost your marketing efforts, and drive your business forward.
How to set up Google Analytics for your POD store

Now that you understand why analytics matter, it's time to set up Google Analytics for your store.
Google has made this process simple. Just follow these steps:
1. Create a Google Analytics account

First, you need a Google Analytics (GA) account.
If you already have one, great!
If not, head over to Google Analytics and sign in with your Google account. The setup wizard will guide you through creating a new account.
During setup, you must enter details like your store name, time zone, and currency.
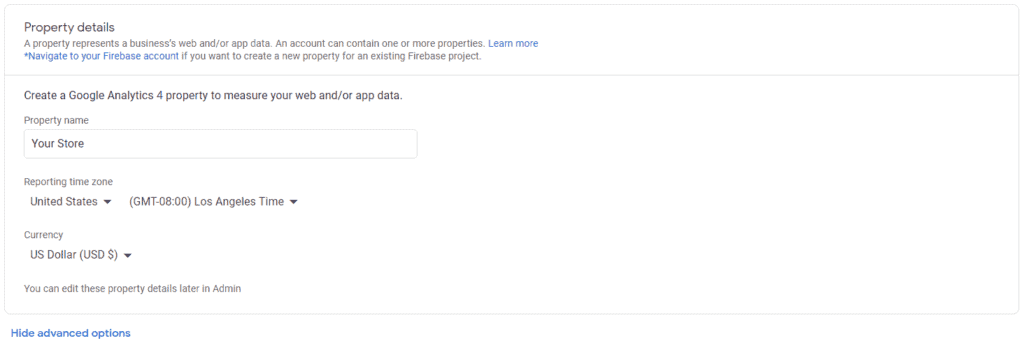
Google will also ask questions about your business, but don't worry; nothing is set in stone. You can adjust these settings later.
Tip: Check out our article, Google Analytics for Ecommerce: A Beginner's Guide (2026), for a step-by-step walkthrough that explains every detail and shows you how to navigate GA with ease.
2. Connect Google Analytics (GA) to your POD store

This step links your store's data to GA.
Once your account is set up, you'll be given a Measurement ID - a unique code that connects your store to Google Analytics.
If you're using Shopify, copy and paste this ID into Online Store > Preferences. Shopify will handle the rest.

For WooCommerce and other platforms, you must add Google's Global Site Tag (gtag.js) to your store's HTML.
Don't let that intimidate you.
It's as simple as pasting the code into the <head> section of your site. If coding isn't your thing, plugins like Site Kit by Google can automate this step.
To confirm everything is working, go to the 'Realtime' section in Google Analytics and open your store in a separate browser or mobile device.
If you see your visit recorded, you're all set!
3. Configure key settings
Before you start tracking, take a moment to configure essential settings to track meaningful data accurately:
- Exclude internal traffic. You don't want your visits skewing the data. In Admin> Data Settings> Data Filters, you can exclude your store's IP address.
- Enable Enhanced Measurement. GA4 automatically tracks key actions like page views, scrolls, outbound clicks, and site searches. To enable this, go to Admin > Data Streams, select your website, and ensure all relevant tracking options are turned on.
- Set up Event tracking. GA4 tracks some events by default, but ecommerce-specific actions like add_to_cart, purchase, and sign_up require manual setup. You can configure event tracking manually via GTM (recommended for non-coders), Google's gtag.js script (for advanced users), or third-party apps.
Once these settings are in place, your store will collect meaningful data.
10 key metrics every POD store should track
Now that your store is connected to Google Analytics, it's time to focus on the data that matters!
Here are the key insights you should monitor.
1. Visitor and traffic

Your store's success starts with knowing who's visiting and how they got there.
Google Analytics and dashboard tools break this down into traffic sources, demographics, and engagement levels.
Not all traffic is equal, though. Knowing where visitors come from lets you focus on what's working.
- Organic traffic. People who find your store through search engines like Google. Strong SEO helps increase this.
- Paid traffic. Visitors from paid ads, including Google Ads and Facebook campaigns.
- Social traffic. Clicks from social media platforms like Instagram, TikTok, YouTube, or Pinterest.
- Direct traffic. People who type your URL directly into their browser. These are often returning customers or those who saved your link.
- Referral traffic. Visitors from other websites, such as blogs or affiliate links.
User Demographics

Who are your customers? Google Analytics provides insights into their age, location, and device use.
- Age and location. Knowing your audience's age range and location helps with targeted marketing.
- Device type. Are more customers shopping on mobile or desktop? If mobile traffic is high but conversions are low, your store might need better mobile optimization.
Note: To gain deeper insights into customer demographics, click 'Advertising Reporting Features' and link your Google Ads account.
Session duration
The longer visitors stay, the better. A high session duration means people are engaged with your content.
If users leave quickly, you may need to improve your site navigation, product descriptions, or page design to keep them browsing.
New vs. returning visitors
Are people coming back, or are they first-time visitors? Google Analytics shows the ratio of new vs. returning visitors.
- A high percentage of new visitors? Your marketing is attracting traffic, but you may need better retention strategies.
- Strong returning visitor rate? Your brand has loyal customers. Try upsells, loyalty programs, and email marketing to increase repeat sales.
2. Store performance metrics
Getting traffic is great, but how well is your store converting visitors into customers?
Store performance metrics give you a clear picture of what's working and what needs improvement.
Let's break down the most important ones:
Conversion rates
Your conversion rate is the percentage of visitors who make a purchase. This is one of the most critical metrics for any POD business!
A low conversion rate could indicate issues with:
- Pricing
- Product descriptions
- Checkout flow
- Trust factors (reviews, security badges)
If visitors are browsing but not buying, consider running A/B tests on product pages, tweaking pricing, or simplifying the checkout process.
Cart abandonment rate
Many shoppers add items to their cart but never complete the purchase. This cart abandonment rate helps you understand how often this happens.
Common reasons include unexpected shipping costs, a complicated checkout process, or a lack of payment options.
To reduce abandonment, offer free shipping, send cart recovery emails, or run retargeting ads.
Bounce rate

A high bounce rate means visitors leave your store without interacting. This could indicate that your site loads too slowly, the design is not good, or your landing pages don't meet your visitor expectations.
To lower your bounce rate, ensure pages load quickly, use high-quality images, and make product descriptions more compelling.
If a particular traffic source has a high bounce rate, revisit the ad or content driving those visitors.
Revenue per visitor (RPV)
RPV measures the average amount of money each visitor brings in. It's calculated by dividing total revenue by the number of visitors.
- Revenue per visitor (RPV) = Total revenue ÷ Number of visitors
If your RPV is low, you might need to increase your average order value (AOV) through upsells, bundles, or discounts.
Improving conversion rates also boosts this metric as more visitors become paying customers!
3. Product performance metrics
Not all products perform the same.
Some drive the majority of your revenue, while others barely sell.
Tracking product performance metrics helps you focus on what works and optimize your store for higher profits.
Top-Selling Products

Your top-selling products are the backbone of your business.
Customers love these items the most, and they can guide everything from marketing strategies to inventory decisions.
In GA, set up your key events (like purchase events) and mark them as conversions since GA no longer uses traditional goals.
Also, if some products aren't selling, it may be time to update their listings, improve images, or remove them altogether.
Average Order Value (AOV)
AOV measures the average amount customers spend per order. A higher AOV means you're making more money per sale without needing extra traffic.
To increase AOV, try:
- Upselling complementary products
- Offering bundle discounts
- Adding free shipping for higher purchase amounts
Such minor tweaks can lead to a significant revenue boost!
Repeat Customers
Getting customers to buy once is great, but getting them to buy again is even better!
If you notice a low repeat purchase rate, look into email marketing campaigns and loyalty programs.
Customers who already trust your store are the easiest to convert again.
How to use Google Analytics to optimize your POD store
Tracking data is just the beginning. The real value comes from using those insights to make informed decisions.
To maximize revenue, Google Analytics helps you refine your product strategy, marketing campaigns, and user experience.
Here's how to use it effectively:
1. Identify best-performing products

Know what's driving your sales.
GA shows which products drive the most revenue and engagement.
Go to Monetization > Ecommerce Purchases to see which products sell and how revenue is distributed.
If a product performs well, consider promoting it more through ads, social media, or email campaigns.
For underperforming products, test new images, adjust pricing, or improve descriptions to increase conversions.
2. Improve your marketing strategy
Understanding where your traffic comes from helps you determine which marketing channels and growth strategies to focus on.
Go to Acquisition > Traffic Acquisition to see which organic, paid, social, or direct sources drive the most visitors and conversions.
If organic traffic is strong, double down on SEO efforts. Publish more optimized content and refine existing pages.
If paid ads perform well, scale them gradually while monitoring ROI.
If social media traffic is low, experiment with different content formats, influencers, or alternative platforms to boost engagement.
3. Reduce cart abandonment

Many visitors add items to their cart but don't complete checkout. GA helps identify where they drop off, so you can fix the issue.
Check Reports > Monetization > Checkout Behavior to see when and where customers abandon their carts.
If the drop-off happens at checkout, simplify the process, add trust signals, or offer free shipping.
If they leave after adding to the cart, use retargeting ads or abandoned cart emails to bring them back.
4. Get SEO insights
Organic traffic is free and scalable, but you need the right strategy!
- Go to Acquisition > Traffic Acquisition to see how much traffic comes from organic search.
- Google Analytics won't show keyword rankings, but Google Search Console does. Link it to your Analytics account to track search queries.
- Identify your best-performing landing pages and optimize them further with high-intent keywords.
Note: GA4 no longer shows granular keyword rankings. To view that data in detail, link your Google Search Console.
5. Improve site speed
A slow website drives visitors away, increasing bounce rates and lowering conversions.
Go to Reports > Tech > Pages and Screens to find slow-loading pages. Know that pages with high bounce rates and long load times need optimization.
Here's how to optimize slow pages:
- Compress images to reduce load times.
- Use a faster hosting provider for better performance.
- Limit heavy content like videos and high-resolution images per page.
Other valuable tools for tracking and optimizing performance
Google Analytics is powerful, but it's not the only tool you should use.
Combining it with other tracking and optimization tools gives you a clearer picture of your store's performance.
Here are some must-have tools to take your analytics to the next level:
1. Meta Pixel for ad tracking
If you run Facebook or Instagram Ads, the Meta Pixel is essential!
This tracking tool helps you analyze user behavior, optimize ad performance, and retarget potential customers.
By installing the Pixel, you can:
- Track events like page views, add-to-cart actions, and purchases.
- Create retargeting campaigns for visitors who didn't complete a purchase.
- Improve ad performance by feeding conversion data back to Facebook's algorithm.
Install Meta Pixel on your store through Facebook's Business Manager, then link it to your website.
2. Print on demand platform analytics
Most POD platforms (Printful, Printify, Gelato) have built-in analytics. These dashboards show order trends, best-selling products, and fulfillment times.
Use them alongside Google Analytics for a full traffic and sales performance view.
3. Heatmaps and session recordings

Numbers tell part of the story, but heatmaps and session recordings show how users interact with your site.
Tools like Hotjar and Crazy Egg provide:
- Heatmaps. Visual data on where users click, scroll, and hover.
- Session real-time replays. Watch real-time visitor behavior to spot usability issues.
If users repeatedly drop off at a certain point, you'll see precisely where the problem is and can fix it!
4. Google Search Console

Google Search Console works alongside Analytics to improve your store's SEO. It helps:
- Find site errors. See which pages Google can't crawl and fix them.
- Track customer search behavior. Find out what keywords bring users to your store.
- Click-through rate (CTR) analysis. Improve low-CTR pages by tweaking titles and meta descriptions.
5. Triple Whale

Triple Whale offers predictive analytics and attribution tracking.
It helps answer key questions like:
- Which marketing channels drive the highest ROI?
- How are customer acquisition costs (CAC) changing over time?
- What's the lifetime value (LTV) of your customers?
Triple Whale provides the most value for stores generating over $25K-$50K monthly.
If you're just starting or have lower revenue, you might want to try the free plan and determine whether it meets your needs.
6. Klaviyo

Email marketing is a goldmine for POD businesses, and Klaviyo takes it to the next level. It helps with:
- Customer segmentation. Send personalized emails based on shopping behavior.
- Automated email flows. Recover abandoned carts, re-engage past buyers, and welcome new customers.
- Revenue tracking. See exactly how much money each email campaign generates.
Pairing Klaviyo with Google Analytics gives you a complete view of customer journeys, from first visit to repeat purchase.
Action plan helper
Turn this guide into a simple checklist
Open this article in ChatGPT and get the next steps for your dropshipping store.
Prefer another tool?
Summary
Before we go, we've created a quick summary of this article for you so you can easily remember it:
- Set up Google Analytics to track your store's traffic and performance.
- Monitor traffic sources to see where your visitors are coming from.
- Track conversion rates and cart abandonment to improve sales.
- Use SEO insights to optimize your store for organic search.
- Analyze heatmaps and session recordings to improve user experience.
- Leverage email marketing and retargeting to boost repeat purchases.
Conclusion
Tracking your analytics gives you a clear window into your customers' behavior and helps you improve your marketing strategy for better sales.
Google Analytics, combined with Meta Pixel, heatmaps, email automation, predictive analytics tools, and company performance dashboards, provides the insights needed to grow your store.
Keep exploring your data, experiment with new ideas, and adjust your strategies based on your learning.
Have a great day!
Want to learn more about POD?
Ready to move your print on demand store to the next level? Check out the articles below:
- Shopify Email vs Klaviyo in 2026: Features & Pricing
- What Is Shopify's Shop Channel? (And How Do You Use It?)
- Google Analytics for Ecommerce: A Beginner's Guide (2026)
Plus, don't forget to check out our in-depth how-to start a print on demand business guide here!